
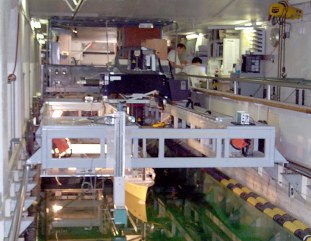
Experimental setup shows model 5512, phase-tracking servo-type wave gage in the foreground, and the 2DPIV system in the background.
Experiment
Results are presented from towing-tank tests of forces and moment, wave elevation, and phase-averaged nominal wake velocities and Reynolds stresses for a surface combatant advancing in regular head waves, but restrained from body motions, i.e., forward-speed diffraction problem. The geometry is DTMB model 5512, a 1:46.6 scale, 3.048 m long, fiber reinforced Plexiglas hull. Model 5512 is a geosim of DTMB model 5415, a 1:24.8 scale 5.72 m model. The model is unappended, i.e., not equipped with bilge keels, shafts, struts, propellers, or rudders. The experiments are conducted in the IIHR 3x3x100 m towing tank which is equipped with a plunger type wave maker. The measurement systems include 20 kg loadcell, servo and acoustic wave gages, and towed, 2D particle image velocimetry. Uncertainty assessment following standard procedures is used to evaluate the quality of the data. The raw data is processed with fast-Fourier transform and Fourier series to determine the harmonic content in the response of the forces and moment, free surface, and nominal wake. The harmonic content is presented as the final data and is available to download at the link below. Please consult the list of variables for definition of the forward speed diffraction variables. The UA results are published in the references below.
Data, Equipment, and Conditions
| Data | Equipment | Fr | l / L | Ak | Locations |
| Forces and moment | 20 kg loadcell | 0.05-0.45; DFr = 0.05 | 0.5, 1.0, 1.5 | 0.025, 0.05, 0.075, 0.10 | – |
| Near field wave elevations | Servo-type wave gages | 0.28 | 1.5 | 0.025 | x / L = -0.2-1.3, y / L = 0-0.082 |
| Far field wave elevations | Capacitance wires | 0.28 | 1.5 | 0.025 | x / L = -0.2-1.3, y / L = 0.082-0.39 |
| Nominal wake flow field | 2DPIV | 0.28 | 1.5 | 0.025 | x / L = 0.935, y / L = -0.06-0, z / L = -0.06-0 |
Sample Image
The experimental setup below shows model 5512, phase-tracking servo-type wave gage in the foreground, and the 2DPIV system in the background.
Sample Data
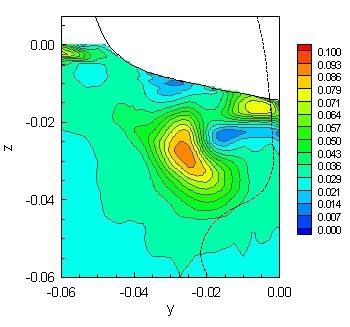
The image below shows the contours of 1st-harmonic amplitude for the axial velocity component U.
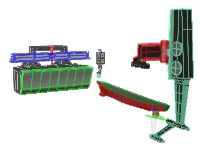
The graphic below shows the 2D contours of free surface elevation around model 5512 in waves for Fr = 0.28, l = 1.5L, Ak = 0.025; the histograms show the unsteady resistance (red), heave force (green), and pitch moment (blue).
References:
Longo, J., Shao, J., Irvine, M., and Stern, F., “Phase-Averaged PIV for the Nominal Wake of a Surface Ship in Regular Head Waves,” ASME J. Fluids Eng, Vol. 129, May 2007, pp. 524-540.
Longo, J., Shao, J., Irvine, M., and Stern, F., “Phase-Averaged Nominal Wake for Surface Ship in Regular Head Waves,” IIHR Report No. 447, November 2005, 68 pp.